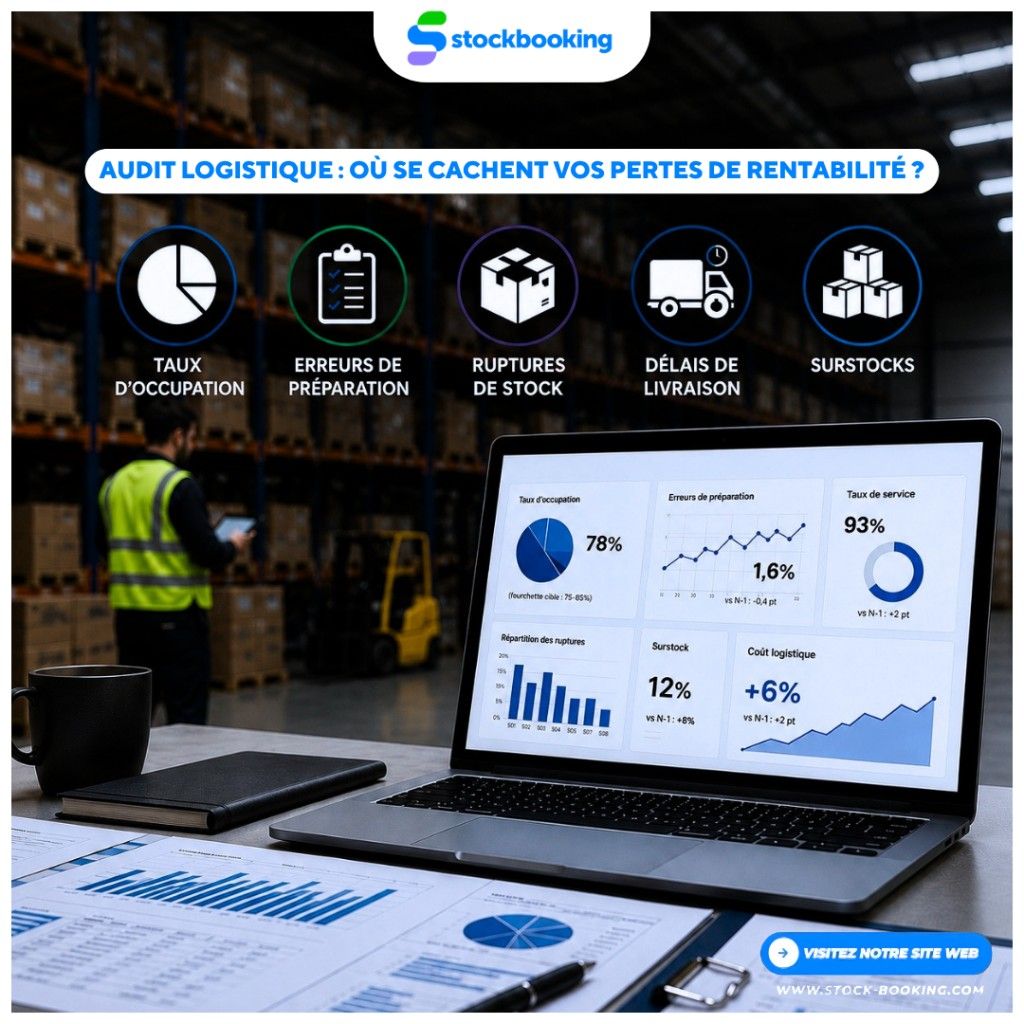
Logistics profitability losses: a signal often invisible in daily operations
A warehouse is running, orders are shipping, and carriers are collecting their routes: at first glance, everything works. Yet most logistics profitability losses hide precisely within this apparent normality. A misplaced pallet, an order picked twice, inventory sitting three weeks too long: each anomaly seems insignificant on its own. Added up over a month, they often represent several margin points lost without triggering any alert.
This is the role of a logistics audit: to turn diffuse signals that are difficult to assess day to day into measurable, actionable indicators. This article details the main warning signals, the methodology for a structured logistics audit, and a concrete client example. For an overall assessment of your warehouse performance, also see our guide to the logistics diagnostic.
Why logistics profitability deteriorates before anyone sees it coming
Warehouse profitability rarely deteriorates suddenly. It erodes in small layers: an activity peak that was poorly absorbed becomes the new normal, an organization designed for a volume that has since doubled, or an information system that provides only a partial view of flows. As a result, operating teams manage emergencies, but no one steers long-term performance.
Three factors explain why these losses remain invisible for too long:
- No benchmark. Without an indicator tracked over time, a 3 % error rate or 60 % occupancy rate means little by itself; its trend and comparison with an industry standard make it meaningful.
- Diluted accountability. A stockout may originate in purchasing, demand forecasting, or warehouse receiving. Without a cross-functional audit, each department points to the next.
- Urgency bias. Logistics teams are evaluated on their ability to deliver despite disruptions, not on the hidden cost of that absorption capacity.
A logistics audit moves the organization beyond this reactive approach by using data to establish what is truly affecting profitability. For continuous monitoring of these indicators, also see our article on logistics performance and management KPIs.
A framework for interpreting warning signals
Before discussing methodology, you need to know what to examine. The following indicators are ranked by their generally observed impact on warehouse profitability.
1. Warehouse occupancy rate
An occupancy rate that constantly fluctuates between 90 and 100 % is almost as problematic as one that remains below 50 %.
- Too high: it indicates saturation that slows movement, complicates putaway, and increases the risk of picking errors because maneuvering space is limited.
- Too low: it indicates oversized leased space and therefore a fixed cost weighing on every order shipped without an operational justification.
The right indicator is not a static average but a target range that remains stable over time—generally 75 to 85 % depending on the industry—with seasonal peaks anticipated rather than endured.
2. Order picking error rate
This is often the indicator most directly correlated with profitability because every error creates cascading costs: carrier return, data reentry, repicking, and sometimes a customer credit and dissatisfaction.
An error rate above 1 % should be considered a serious warning signal in most physical distribution sectors. Beyond the overall rate, the audit must distinguish between:
- quantity errors,
- item errors,
- errors related to labeling or traceability issues,
because each category points to a different root cause (picking organization, product data quality, or team training).
3. Stockouts and excess inventory
Stockouts and excess inventory are two sides of the same demand management problem. A company experiencing repeated stockouts on some items while tying up capital in slow-moving items does not have an inventory problem; it has a forecasting and replenishment policy problem.
The audit must cross-reference two data points that are too rarely analyzed together:
- service level (orders delivered in full and on time),
- inventory turnover by product family.
A deteriorating service level against a background of rising overall inventory is one of the clearest signs of structural profitability loss, regardless of activity volume.
4. Secondary indicators that should not be overlooked
Some less visible signals usefully complete the framework:
- Cost of logistics non-quality: cumulative value of claims, returns, and credits related to operational errors.
- Warehouse turnover and absenteeism: an often underused indicator that frequently precedes a decline in picking quality.
- Gap between system and physical inventory: reveals the reliability of information systems and counting practices.
- Average order processing time (order-to-ship time): a gradual increase, even by a few hours, is often the first visible symptom of approaching saturation.
Methodology for an effective logistics audit
A logistics audit only creates value if it leads to concrete decisions. The following steps structure a rigorous approach.
1. Scope definition and collection of existing data. The audit begins by retrieving data already available in the WMS, ERP, or existing dashboards: historical error rates, inventory levels, and carrier billing data. The goal is to establish an initial snapshot without waiting for new field reports.
2. On-site observation and operational interviews. Numbers alone are not enough. Direct observation, supplemented by interviews with forklift operators, pickers, and team leaders, uncovers daily friction that tools do not always capture: a poorly designed workstation, a storage area saturated at certain times, or a procedure bypassed due to lack of time.
3. Cross-analysis of indicators. This is the key step: cross-reference indicators instead of reading them in isolation. High occupancy combined with a rising error rate and increasing order-to-ship time provides a much more precise diagnosis of saturation than any single indicator.
4. Prioritization of levers by impact and feasibility. Not all identified levers offer the same return on investment. An impact/effort matrix separates immediate actions—often organizational and low-cost—from more structural projects such as relayout, tool replacement, or carrier renegotiation. Once the causes have been established, the next step is often to activate logistics optimization levers.
5. Findings and a quantified action plan. The audit concludes with a presentation that translates each warning signal into an estimated financial impact and each recommendation into a dated action plan with clear ownership.
Client experience
“Before the audit, we knew something was not working properly, but we could not say exactly where. Cross-analyzing our occupancy rate and picking errors showed that Friday pressure peaks alone explained a large share of our carrier claims the following Monday. A simple adjustment to the picking schedule enabled us to reduce errors significantly within a few weeks.”
Supply Chain Director at an industrial SME
This experience illustrates a central point: a logistics audit does not necessarily reveal unknown problems, but it quantifies and prioritizes issues that teams already sensed without having the data to rank them.
Turn audit findings into lasting profitability gains
An audit that remains a report has no value. Three conditions turn the diagnostic into measurable improvement:
- A named owner for each action and a clear deadline, instead of a collective action plan with no assigned responsibility.
- Frequent indicator monitoring during the first weeks after implementation, allowing rapid adjustment if a lever does not produce the expected effect.
- A periodic review—for example, quarterly—to verify that gains continue after audit pressure subsides, as this is often when organizations relax their efforts and indicators deteriorate again.
To quickly establish the condition of your warehouse before taking these actions, you can launch a logistics diagnostic within a few days.
Frequently asked questions
What is the difference between a logistics audit and a logistics diagnostic?
The two terms are closely related and often used interchangeably. In practice, a logistics diagnostic generally refers to an overall assessment of warehouse performance, while a logistics audit focuses on an in-depth analysis of specific indicators to identify their root causes and quantify their impact on profitability.
How long does a logistics audit take?
The duration varies depending on warehouse size and the availability of existing data, but an audit focused on key profitability indicators can be completed in a few days when the data is already structured in a WMS.
Which indicators should be prioritized if only three can be selected?
Together, the occupancy rate, picking error rate, and service level (cross-referenced with inventory levels) cover most causes of profitability loss identified during an audit.
Is a logistics audit useful for an SME with a small warehouse?
Yes. Threshold effects are often more pronounced in smaller operations, where the same picking error or saturation point has a proportionally greater impact on overall profitability.